
IFGF 2017 - ÍNDICE FIRJAN DE GESTÃO FISCAL - ANO BASE 2016
PÁG. 15
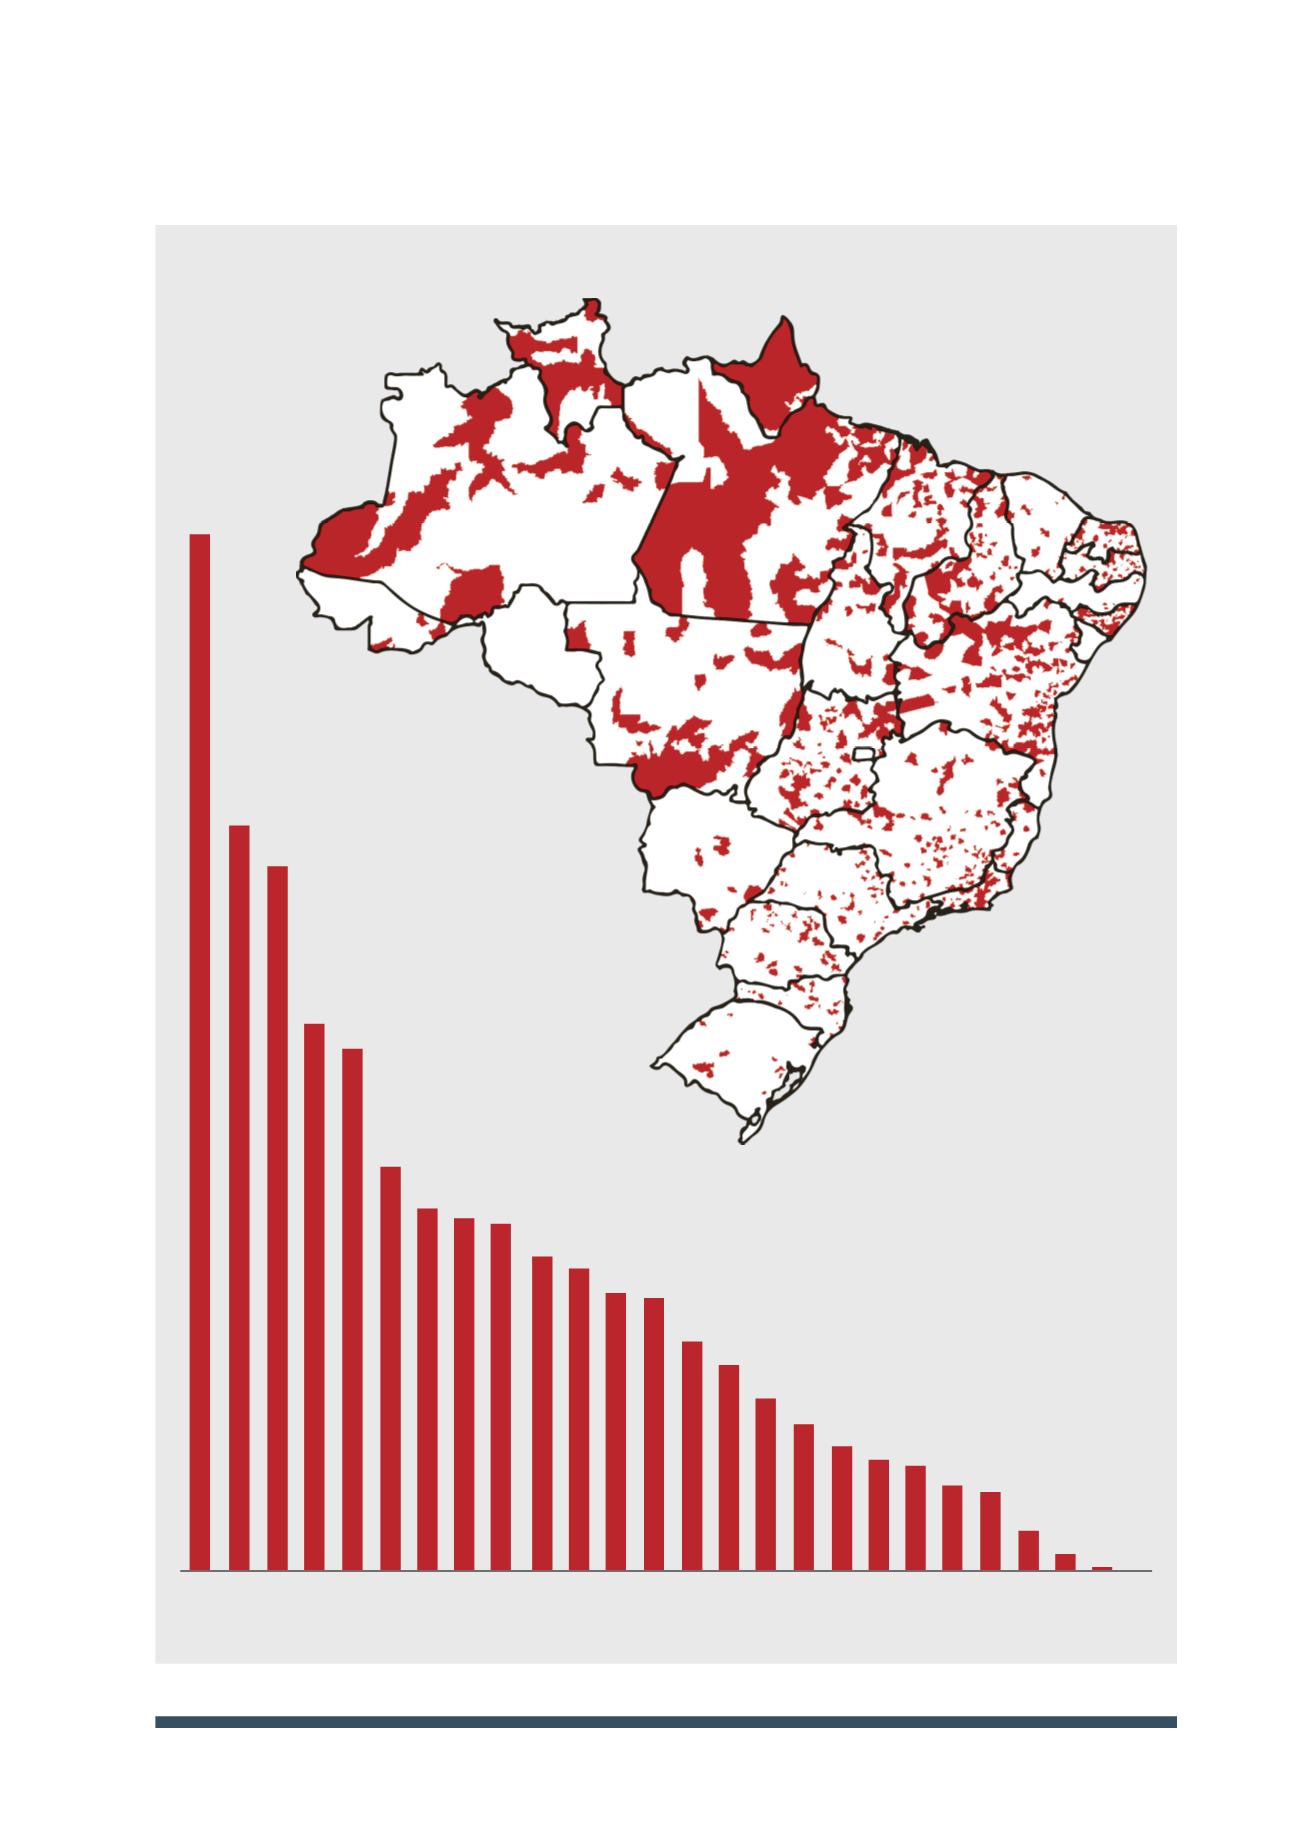
GRÁFICO E MAPA 1:
Percentual e número de municípios sem dados disponíveis, por UF
RS
49
(7,6%)
SP
CE
MS
ES
TO
AM
GO
MA
RN
RR
91
(63,2%)
PA
SE
PE
SC
PR
113
(13,2%)
MG
AC
53
(23,8%)
PB
MT
125
(30,0%)
BA
PI
41
(44,6%)
RJ
AL
14
(87,5%)
AP
RO
61
7
58
70
66
67
37
15
28
4
12
9
41
18
24
8
12
1
0


